Against my better judgement, I got drawn into a Facebook debate this weekend.
It became clear as I was e-conversing with my old friends that many non-pro-choice people do not realize abortion rates in the US are in decline, and have been for decades. This phenomenon is an overall positive for anyone whose goal is to minimize induced abortions, which is desirable regardless of political ideology.
This post will not be a diatribe. Rather, it will simply share statistical findings I pursued as a result of this conversation. These findings suggest a clear and likely continued reduction in abortions in the US for the foreseeable future.
Below is a chart of abortion rate by year. As is evident from the below graph, the abortion rate in the US peaked in the early 1980s, several years after rapid increase following the Supreme Court’s Roe v Wade decision. It has fallen steadily since then.
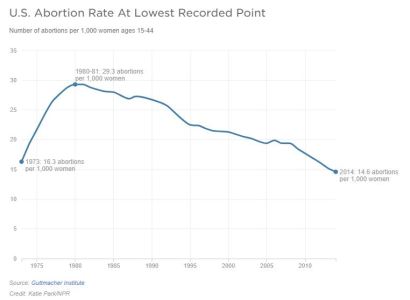
Something happened in the early 1980s which caused a significant decline in abortions, and this trajectory has continued for decades. There is no evident expert consensus on what caused this drop. One possibility is that this directional change was caused by a combination of easier access to birth control, education, lower organic birth rate, and perhaps evolving social stigma associated with abortion.
There are slight increases (or at least slowed decrease) during economic recessions – those recessions were in 1987, 1990, 2000, and 2008.
I conducted statistical analysis to determine what might happen to abortion rates in the future by building statistical models and feeding future parameters into those models to derive predicted values.
Methodology
Data is from Wikipedia, which uses CDC data. I appended onto the data the political party which controlled the presidency during the years in the dataset. I used R-Studio software, which in my mind is the best statistical package in the world…at the very least, the best free one :). My dataset looked as follows:
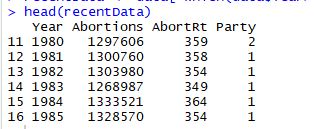
*Note: The AbortRt variable represents the induced abortion rate per 1,000 live births. In 1980, around peak abortion rate, there were 359 abortions per 1000 live births.
The first model
I used a simple linear model, transforming Abortion count into its logarithm (log(Abortions)). For example, the log of abortions in 1980, 1.29mln, is approximately 14.07. The model therefore was
log(Abortions)=Year+Political Party
Below are coefficients of the model.
log(Abortions)=(-24945*Year)+(47753*Political Party)
In this model, the R² (correlation between the input and output variables) is about 83%, and the model’s p-value is nearly 0, indicating this is a good model. In my own experience, this quality of model is very good, given the lack of other input variables.
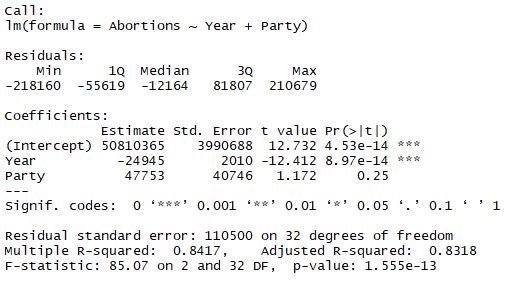
Things to note:
- The p-value of the Political Party variable is .25, suggesting it does not contribute much to the model.
- When I remove Party from the model, I get roughly the same results. Occam’s razor says that the better model is simply
log(Abortions) = Intercept+(Coefficient* Year) - The residuals (error) in the model is quite wide, and not quite centered around 0, suggesting a problem in the model.
- In the revised model, which excludes Party, the equation is
log(Abortions) = 72.509077 + (-0.029358*Year) (p=2.254e-09) - Notice that the coefficient of the revised model is -.029358. In other words, the negative coefficient in the model means that the trend line is decreasing every year. This is self-evident, but noteworthy.
Another Model
I wondered if abortion rate might be more useful than raw abortion numbers. When I built a model targeting abortion rate rather than count, political party again was again insignificant.
The model was: AbortionRate = Intercept + (Coefficient * Year).
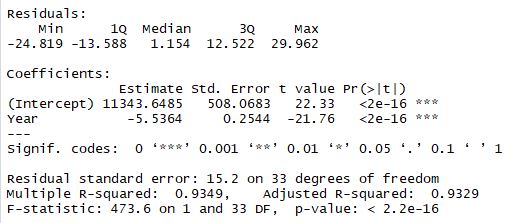
This rate model is better than the first. Its error residuals were narrower and more centered around 0 than the first model. It has a lower p-value for the overall model, and a R² (correlation between the input and target variables) of about 93%.
Predictions with this model
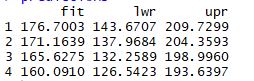
The abortion rate per 1000 live births for the most recently available year, 2014, is 186. Using the rate model, I predicted abortions for years 2017-2020 (2017 abortion data for the US is not evidently available). By 2020, this model predicts the abortion rate will be 160.09 per 1000 live births (95% confidence interval is [126.5423, 193.6397]).
Further Discussion
The primary problem with the best model in this paper is that it does not include any relevant explanatory variables which might give insight into what brought on the eventual drop in abortion rate. We hypothesize reasons, but did not include any statistical tests, aside from presidential political party. We investigated other variables not discussed in this paper, including minimum wage and unemployment. Neither significantly affected the model’s performance.
We used other modeling techniques, as well, such as machine learning; however, the simple linear model was the best of the models we attempted. Given the observed curvature of the actual data, some other sort of geometric transformation of the data would probably render better fit and predictions. As with any non horizontal linear model, there is also the question of sustainability of the trend. It is plausible that the decreases will slow in the coming years, especially if the US experiences another recession, following the earlier observation that economic recessions seem to put upward pressure on abortion rates. Also worth studying is whether economic indicators apply significantly to this model. We also suspect that political party of the president, as well as political party of Congress, may well have a contributing effect to a hypothesized model; this suspicion assumes that there is some lag between policy implementation and actual perceived effects on rate change. For example, if a policy is implemented under one political party, it might not necessarily take effect until another political party comes to power.
Conclusion
It is difficult to know whether the abortion rate trajectory from 1980 to 2014 will continue to hold. At present, it is falling 5.5 abortions per 1000 live births per year. If it continues this rate, by 2020 the abortion rate will 160 per 1000 live births, which is a 55% decrease from its peak in 1980, and 14% lower than the most recently available year. Given that many of the hypothesized reasons for the original trajectory change in the early 1980s, including easy access to birth control, as well as early sex education, it is plausible that ongoing abortion rate reductions will continue. Anyone who wishes to see a significant reduction in abortion rate should take at least some comfort in these numbers.

Brilliant.
LikeLike
Bringing it back to Early Christian writings, I remember being surprised by the fact that abortion was indeed an issue to early Christians, and that apart from the accusations against certain Gnostic groups, it was generally considered a terrible sin.
“you shall not murder a child by abortion nor kill that which is born” – from Didache Chapter 2
I would say the Modern Western World narrowly dodged a bullet by not having the Didache as part of the Christian Canon.
LikeLike
Too bad Jesus’s dad is a militant pro-abortion in the sense he uses the military to perform one. But he isn’t technically pro-choice because it has never occurred to him to give people one.
LikeLike
I think a part of the reason why abortion rates are falling aside from sex education and easy access to birth control is that the stigma of having a kid out of wedlock is no longer deemed shameful.
LikeLike
Agreed.
LikeLike